SCOM Management pack for SQL Server Reporting Service 2012
- Download the MP here --> Click here
Microsoft SQL Server Dashboards Management Pack provides an ability to create and customize visualization on the fly.
There are two views in the SQL Server
Dashboards;
- Datacenter view
- Instance view
The Datacenter
view is an aggregated view. The Instance
level provides detailed information about the selected object.
Datacenter View:
The Datacenter view is the Dashboard which provides information about the datacenter health state in an aggregated
way. It is possible to drill down from the Datacenter view to the Instance view
in order to investigate the root cause of the issue. It is possible to return to the home
page from any Instance view by clicking the Home part of the navigation pane.
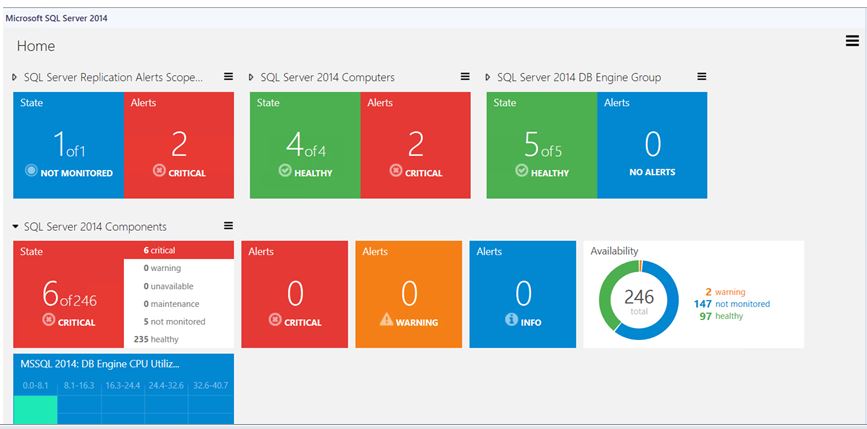
Datacenter View Tiles:

Datacenter view tile consists of
two parts; the left part displays the number of objects within a group in the
worst state and a total number of objects. The right part of the widget displays
the number of alerts with the highest severity.

The expanded mode shows the number of objects in other
states in addition to the data which is displayed in the collapsed mode.

By default when Alerts widget is expanded it displays three Alert widgets:
Critical, Warning and Info. The number of alerts for each alert type is displayed
within the corresponding widget.

The Aggregated performance tile shows five
columns each representing the number of
objects in the current data range.
Instance View:
Instance View of the Dashboard opened while
drilling into a group or an object from the previous Instance view or
Datacenter Dashboard is provided below:

No comments:
Post a Comment